
How to Use TradingView: A Step-by-Step Beginner’s Tutorial
TradingView is a charting platform and social network that describes itself as being used by more than 100 million traders and investors worldwide. TradingView’s popularity makes it a common starting point for market analysis across global markets. The quickest way to learn how to use TradingView is to follow one simple loop: create a free TradingView account, open a price chart, pick a timeframe, add an indicator or two, mark the price levels that matter, set an alert, and practise with simulated trading before you start trading with real money.
Let’s cover each step in that order, including the plan limits you will meet on day one.
What Is TradingView?
TradingView launched in 2011 and runs in a web browser, as a desktop app, and as a mobile app. Its main product is Supercharts, the charting workspace, which gives direct access to data feeds covering more than 3.5 million instruments across several asset classes, including stocks, indices, forex pairs, crypto, bonds and futures. Around the charts sit screeners, heatmaps for stocks, exchange-traded funds (ETFs) and crypto, an economic calendar, a news feed and a community that publishes trade ideas and scripts.
TradingView, which people also search for as “trading view”, is best understood as a charting and analysis platform that also works as a trading platform through broker connections. Studying a market on it is free. Placing real orders requires a connected broker account, through which you can trade directly from the chart.
Screeners filter markets by criteria you set, which helps identify trading opportunities worth researching further. The social side of the platform overlaps with what some call social trading functions: users share ideas, scripts, and comments. Copy trading, where trades are replicated automatically, is a different product, and QuoMarkets covers it on its social trading page.
How to Create a TradingView Account
Setting up takes a few minutes.
- Go to tradingview.com and choose the sign-up option.
- Register a free TradingView account with an email address or a social login such as Google or Apple. The free plan needs no credit card.
- Confirm your email if TradingView asks you to.
- Open Supercharts from the Products menu.
The free plan is called Basic. The paid premium plans (Essential, Plus, Premium and Ultimate) add capacity and features, and each one can be tried before paying, so there is no need to choose a plan up front.
Finding Your Way Around the TradingView Dashboard
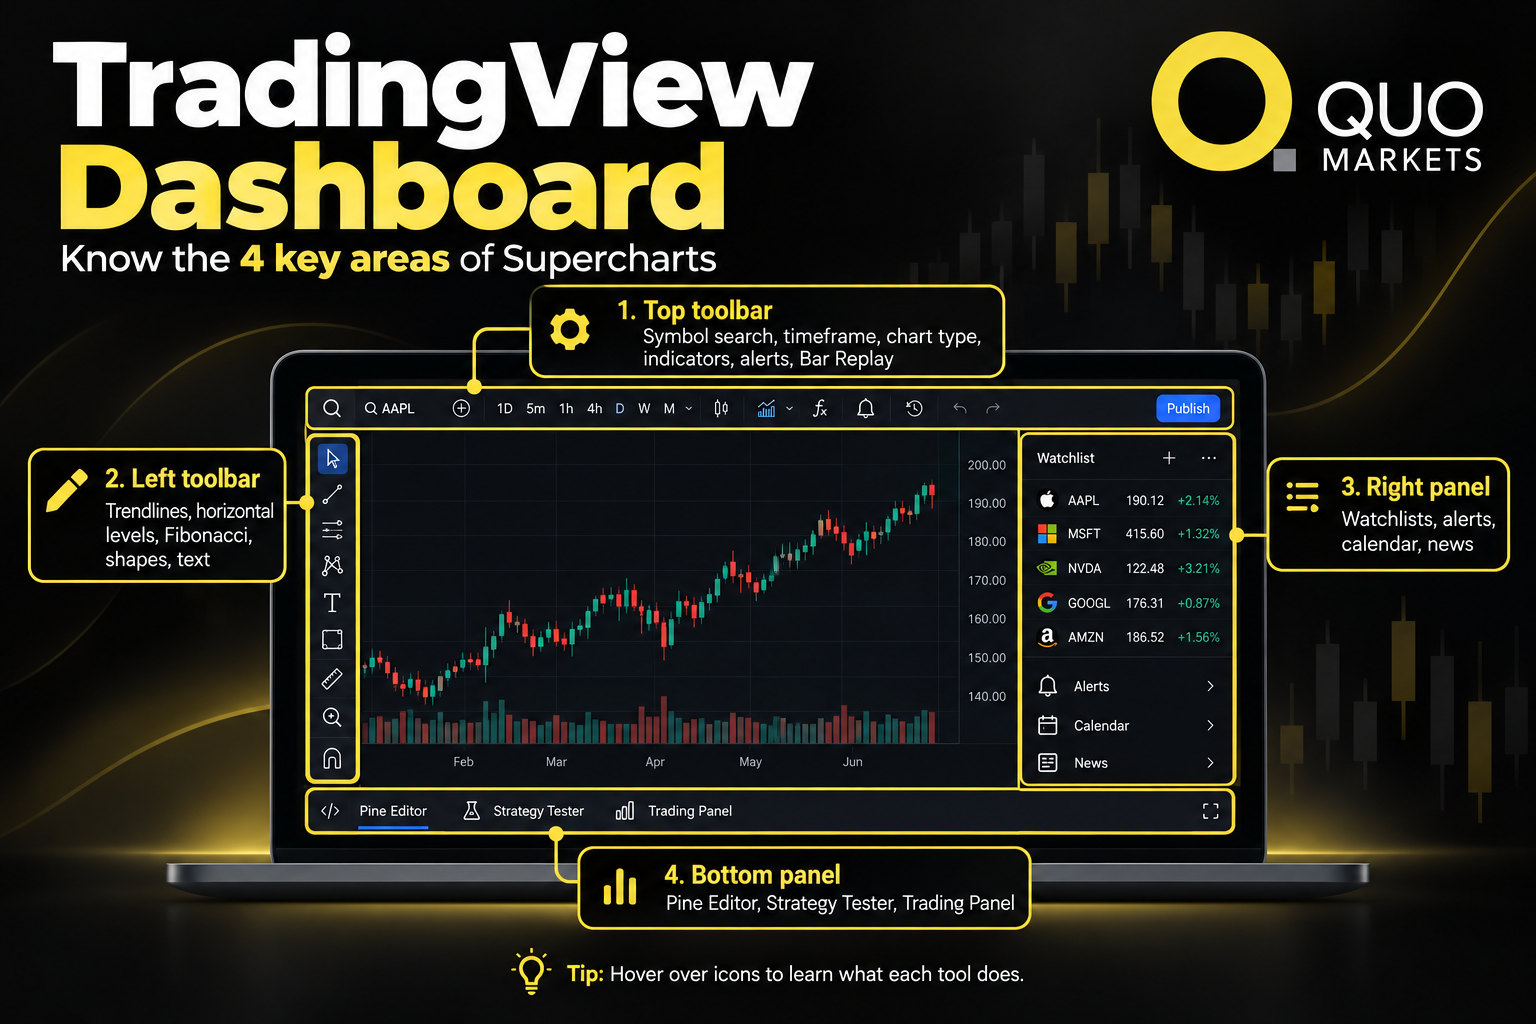
Supercharts, the core of the TradingView platform, brings its charting tools together in four areas worth recognising before you change anything.
- Top toolbar: symbol search, timeframe selector, chart type, indicators, alerts and Bar Replay.
- Left toolbar: drawing tools such as trendlines, horizontal levels, Fibonacci retracement, shapes and text.
- Right panel: watchlists and alerts, plus widgets for the calendar and news.
- Bottom panel: tools such as the Pine Editor, the Strategy Tester, and the Trading Panel used to connect a broker and manage orders and positions.
Hover over any icon to see its name. Most of what follows happens in the top and left toolbars.
How to Read and Customise TradingView Charts
Search for a symbol
Click the symbol box at the top left and type a name or ticker, such as EURUSD, gold, or Apple. Results show the exchange or data source, which matters because the same instrument can have several listings.
Pick a timeframe
The timeframe sets how much time each candle represents, from one minute up to a month. Higher timeframes show the broader direction of a market, and lower ones show detail. Reading several timeframes together, for example, a daily chart for context and an hourly chart for detail, is a common way to avoid over-interpreting a single view. The right mix depends on your trading style, since shorter timeframes suit shorter holding periods and longer ones suit holding for weeks or months. Custom intervals need a paid plan.
Choose a chart type
Candlestick charts are the usual starting point for reading an asset’s price. Each candle shows the open, high, low, and close for its period, and its colour shows whether price closed above or below the open. Line charts plot closing prices only, and Heikin Ashi charts smooth out short-term price movements. TradingView offers more than 20 chart types. The subscription comparison lists 17 customizable chart types for Basic, Essential and Plus, and 21 for Premium and Ultimate.
Customise and save
TradingView’s customisable charts start with the gear icon, which opens chart settings for colours, scales, grid lines and trading sessions. The Compare symbol button overlays a second financial instrument, which helps when you want to see how two markets move relative to each other. Once the chart looks right, save it as a layout or template, so it loads the same way next time. Basic allows one saved layout.
How to Use Technical Indicators on TradingView
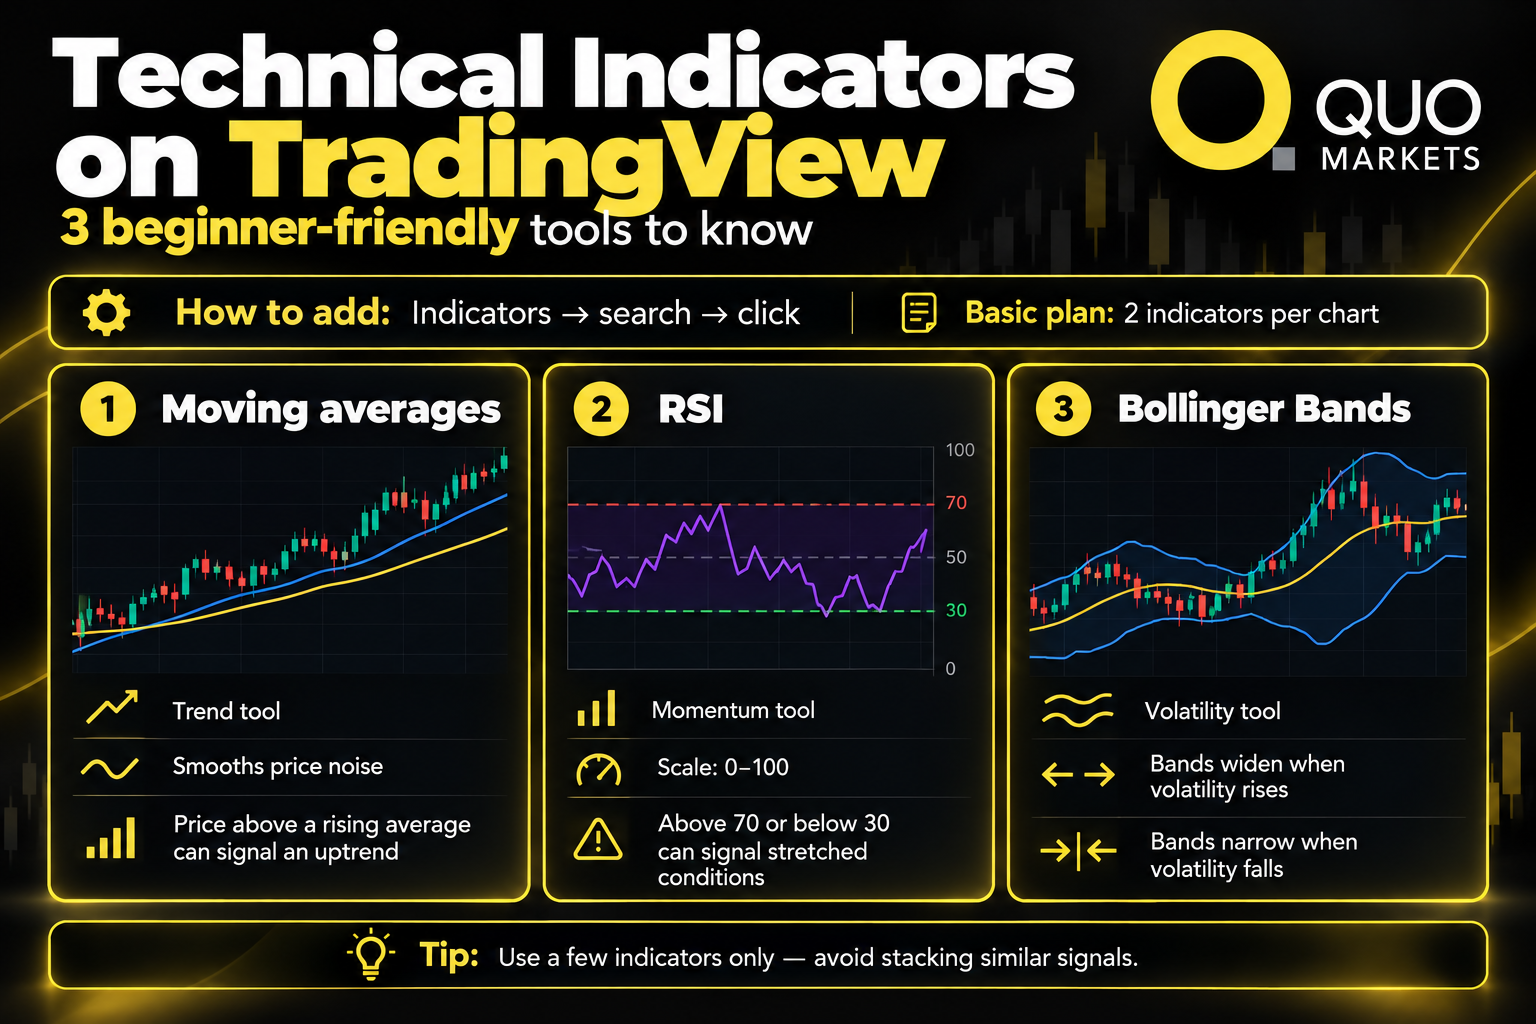
An indicator is a calculation based on price, volume, or both, drawn on or below the price chart. TradingView lists more than 400 built-in indicators and strategies and over 100,000 community-built indicators. Three families cover most of what beginners meet:
- Moving averages (trend): they average price over a set number of periods to smooth out noise. A rising average with price above it describes an uptrend, and the average always lags price.
- Relative Strength Index, or RSI (momentum): it measures the speed of recent price changes on a scale of 0 to 100, using 14 periods by default. Readings above 70 or below 30 are conventionally read as stretched, though in strong trends they can persist for a long time.
- Bollinger Bands (volatility): a moving average with a band a set number of standard deviations either side, 20 periods and two deviations by default. The bands widen when volatility rises and narrow when it falls.
To add one, click Indicators in the top toolbar, search by name, and click the result. Each chart has a cap on how many you can stack, and Basic allows two. The cap is a useful constraint, because several indicators from the same family often say the same thing twice.
Community scripts vary in quality. Read the description, check whether the code is open source, and treat any single indicator as one input among several. Even a seasoned trader does this before relying on a script, and community ideas can offer expert insights but can also be wrong, so test them against your own analysis. Indicators describe past price behaviour, and none is a reliable predictor of what comes next. Advanced users can build custom indicators with Pine Script, TradingView’s programming language and one of its advanced tools. Pine Script also powers custom alerts and strategy backtests, which test a trading strategy (a fixed set of entry, exit and sizing rules) on historical data. A backtest cannot show how live markets will behave.
Drawing Tools: Support, Resistance and Trendlines
TradingView offers more than 110 drawing tools, and three of them go a long way for beginners.
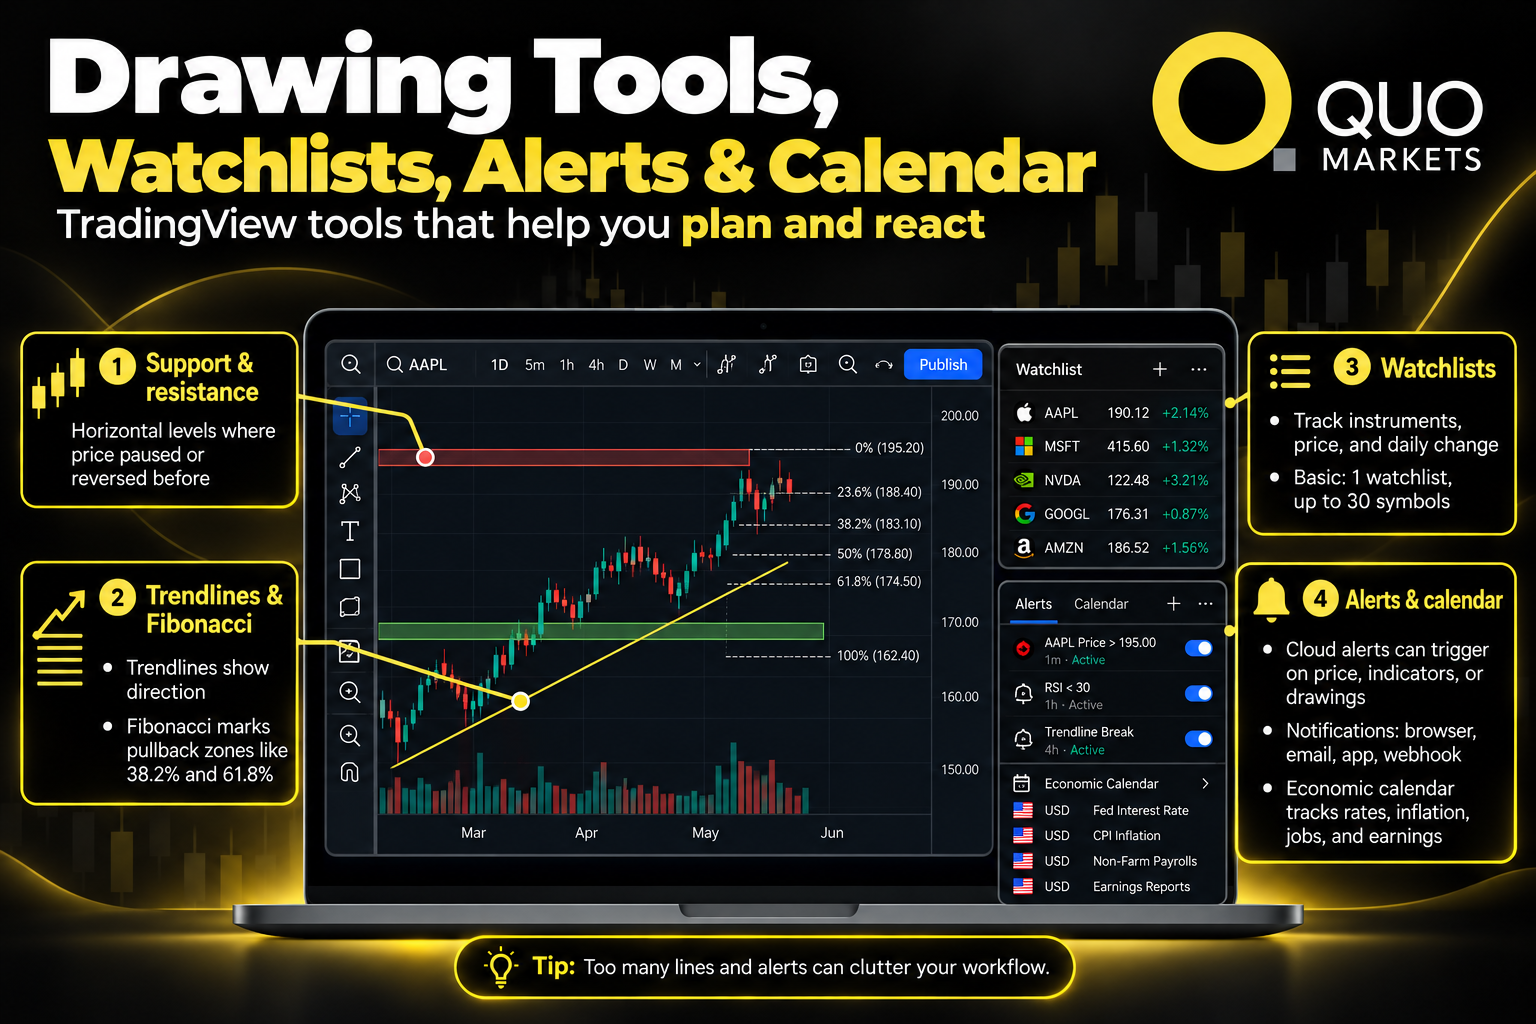
Support and resistance are price areas where a market has previously paused or reversed. A horizontal line at each shows where price has reacted before, and many traders watch those zones again. Trendlines connect a series of highs or lows to show direction and slope. Fibonacci retracement divides a prior price move into ratios such as 38.2% and 61.8%, producing reference levels where a pullback might pause.
These are reference points drawn from past price movements, and price can break through any of them. Adding more lines tends to clutter the chart. Drawings can also trigger alerts, which the next section covers.
Watchlists, Alerts and the Economic Calendar
Watchlists
The watchlist in the right panel keeps your instruments in one list with price and daily change. Basic includes one watchlist of up to 30 symbols.
Alerts
An alert tells you when something happens on the chart so you do not have to watch live markets all day. TradingView’s alerts are cloud-based, run on its servers, and can be delivered to your browser, email, the app, or a webhook. They can trigger on a price level, an indicator condition, or a drawing such as a trendline. To create one, right-click the chart or click the alarm clock icon in the top toolbar, set the condition, and choose how to be notified. Basic includes three active price alerts.
Calendar and news
Prices often react to scheduled data such as interest rate decisions, inflation reports and employment figures, and to company earnings. TradingView’s economic calendar and news feed, which collects media reports on major markets and companies, bring those events into the same workspace. For shares, TradingView also shows financial statements and key ratios, which are the raw material of fundamental analysis. Using fundamental and technical analysis together makes for fuller market analysis than either alone: one asks what a market or company is worth, and the other studies how its price behaves. For more background on the basics, the Investing 101 library is a good next stop.
Using the TradingView App
The iOS and Android apps sync layouts, watchlists, and settings with the web version, so a chart saved on a laptop appears on a phone and the trading experience stays consistent across devices. Push notifications deliver your alerts. The desktop app adds native multi-monitor support. The phone suits checking watchlists and alerts, while a larger screen suits drawing and indicator work.
Practise With Bar Replay and Paper Trading
Bar Replay rewinds a chart to a past date and plays price forward one bar at a time, which lets you practise reading charts without knowing what happens next. Click Replay in the top toolbar, choose a starting point, and step through. TradingView offers several replay speeds, and how far back you can go on intraday data depends on your plan.
Paper trading is TradingView’s simulated trading account. You trade with virtual money and can set the starting balance, currency, leverage, and commissions. Treat it as practice trading. Simulated fills do not reproduce real-world execution in live markets, and trading without real money tends to feel different from trading with it, so practice results say little about live results.
Free vs Paid TradingView Plans
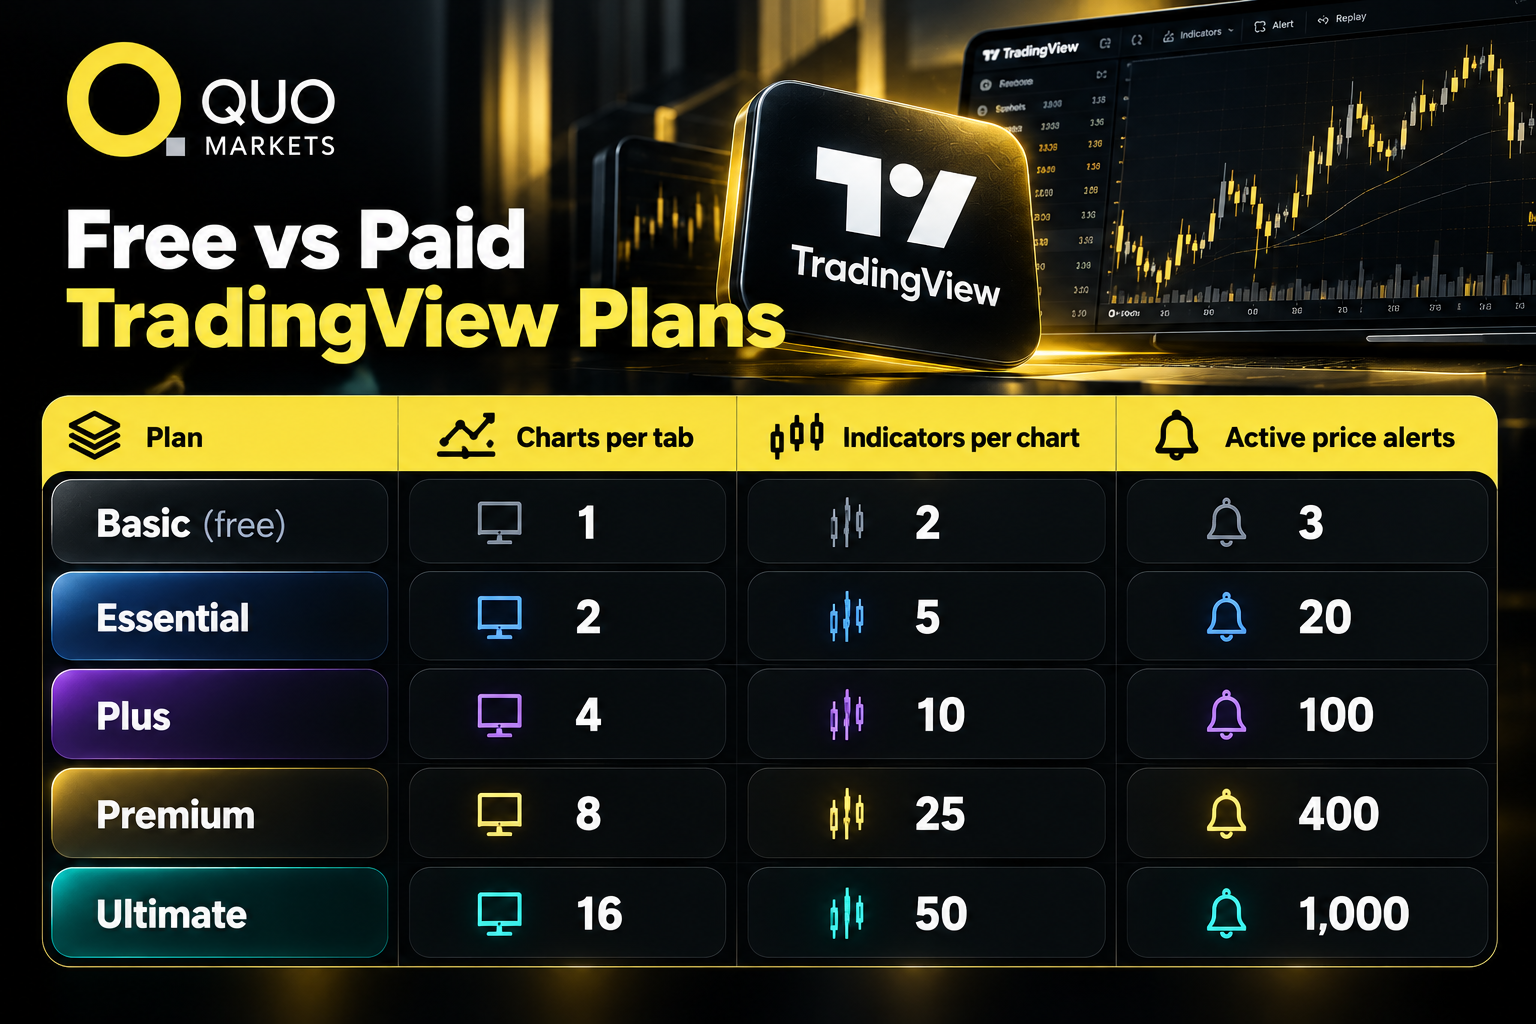
The limits below come from TradingView’s pricing page as of 31 October 2026. Check the page before subscribing, because plans change from time to time.
Basic is enough to learn the interface and the platform’s core analytical capabilities, though two indicators per chart and one saved layout mean you will reach its ceiling quickly. Paid plans also remove ads and raise other limits, including historical data depth and the number of saved layouts.
Common Beginner Mistakes
- Stacking indicators. Five indicators that all derive from price tend to confirm each other without adding information.
- Skipping the higher timeframe. A pattern on a five-minute chart can look very different on a daily one.
- Reading replay or practice results as a forecast. They show how you handled known history or simulated fills.
- Ignoring position size. CFDs are complex instruments with a high risk of losing money rapidly because of leverage, so size positions to fit your financial situation and know in advance how you would close positions if a trade moves against you. A position-size calculator helps define exposure before an order, and QuoMarkets explains its trading calculator in TradingView. A trading journal helps you review decisions afterwards.
Trade on TradingView with QuoMarkets
Analysis and execution can sit in the same window. A QuoMarkets account connects to TradingView, so clients can trade from the TradingView chart in one interface. The QuoMarkets support centre covers account setup and platform questions.
In practice, that means:
- TradingView charts come with professional indicators, drawing tools, and multiple timeframes.
- Clients can test ideas on historical data.
- Charts and layouts are accessible on any device.
- Price alerts can be set directly on the TradingView chart.
A demo account lets clients practise on MetaTrader or TradingView, and no deposit is required. It is worth reading how demo and live accounts differ first, since simulated conditions are not the same as live trading.
There is also a TradingView Premium offer. Traders who open an account through the QuoMarkets portal receive a TradingView Premium subscription at no cost. On TradingView’s pricing page, Premium includes eight charts per tab, 25 indicators per chart, and 400 active price alerts, which leaves a beginner room to grow into the platform’s capabilities.
Disclaimer: Trading CFDs, including oil and other commodities, involves a high level of risk and may not be suitable for all investors. Leverage can work both for and against you, magnifying both profits and losses. Past performance is not a reliable indicator of future results. Please ensure you understand the risks involved and seek independent financial advice if necessary before trading.