

Table of Contents
- Introduction: Why Gold Deserves Its Own Playbook
- XAU/USD Analysis in Today’s Market
- The Main Fundamental Forces Behind Gold Prices
- Technical Indicators That Help Traders Time the Market
- Combining Fundamentals and Technicals into One Strategy
- A Real Example of Gold Market Analysis
- Conclusion
- FAQs
Gold Market Analysis: Combining Technical and Fundamental Insights
Gold has always held a unique position in the financial world. It is a commodity, a currency alternative, and a centuries-old store of value all at once. For modern traders, carrying out a proper XAU/USD analysis means doing far more than checking a chart or reacting to headlines. It requires understanding both the bigger economic picture and the short-term behavior of price movements.
When gold price analysis becomes part of your daily routine, trading decisions stop being based on guesswork. Instead, they are built around the relationship between global economic conditions, investor sentiment, and market momentum.
XAU/USD Analysis In Today’s Market
One of the biggest challenges in gold trading is the number of factors that influence price movement. Unlike company stocks, gold does not produce earnings or pay dividends. Its value depends largely on what is happening across the wider economy.
When traders perform an XAU/USD analysis, they are often measuring two things at once: the strength of the US dollar and the overall confidence or fear in global markets.
Whether you are searching for a gold price forecast for next week or building a long-term gold price prediction for the end of the year, the strongest strategies usually combine two elements: understanding why the market is moving through fundamentals and identifying when to enter through technical analysis.
The Main Fundamental Forces Behind Gold Prices
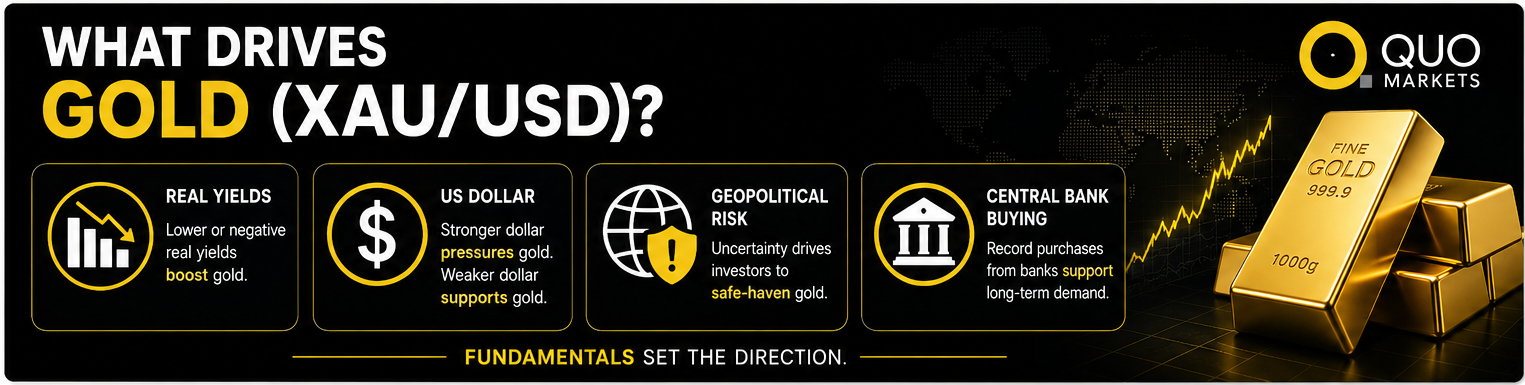
To understand the gold price outlook, traders first need to focus on the foundations of the global economy. Gold fundamental analysis looks at the forces that shape long-term trends. Technical analysis may help identify entry points, but fundamentals explain whether a move has enough strength to continue.
Inflation And Real Interest Rates
One of the biggest gold price drivers is the connection between inflation and interest rates. Gold is widely viewed as a safe-haven asset and a traditional hedge against inflation. The key factor, however, is real yields, which are calculated by subtracting inflation from interest rates.
When real yields are low or negative, holding gold becomes more attractive because the opportunity cost is smaller. On the other hand, when the Federal Reserve policy focuses on higher interest rates to fight inflation, gold often struggles since it does not generate interest income.
The US Dollar And Global Tensions
Since gold is priced in US dollars, the US dollar index impact plays a major role in gold market analysis. In most cases, a stronger dollar pressures gold prices lower, while a weaker dollar supports higher prices.
Geopolitical risk and gold prices are also closely connected. During periods of war, political instability, or economic uncertainty, investors often move funds into gold as a defensive asset. This “safe haven” demand can trigger sharp price rallies that ignore normal market logic because protecting capital becomes more important than chasing returns.
Central Bank Buying And Physical Demand
Physical gold demand and supply analysis also matter. In recent years, central bank gold demand has climbed to record highs, especially from countries such as China and India. Many governments are increasing gold reserves to reduce dependence on the US dollar.
At the same time, seasonal gold demand from China and India for jewelry and investment products helps support the market. Together, these factors create a strong base underneath prices, even during bearish technical conditions.
Technical Indicators That Help Traders Time The Market

While fundamentals explain the broader direction of the market, gold technical analysis focuses on execution. By studying gold price trends on charts, traders can identify where major market participants may be entering or exiting positions.
Using gold technical indicators also helps remove emotional reactions to news headlines and shifts the focus toward actual price behavior.
Moving Averages And Trend Direction
Moving averages remain one of the most widely used tools in trend analysis. Many traders watch the 50-day and 200-day moving averages closely.
When the shorter-term average crosses above the longer-term average, it can signal the beginning of a major bullish trend and a potential gold price breakout. These averages also work as dynamic gold support and resistance levels where prices often pause, reverse, or bounce during corrections.
RSI And MACD Momentum Indicators
To measure the strength of a price move, traders often rely on the RSI indicator and the MACD indicator.
The Relative Strength Index (RSI) shows whether gold is potentially overbought or oversold. Readings above 70 usually suggest overbought conditions, while readings below 30 may indicate oversold territory. During strong trends, however, gold can remain overbought or oversold for extended periods, so traders often use RSI signals to identify temporary pullbacks rather than full reversals.
The MACD indicator tracks the relationship between two moving averages and helps traders evaluate momentum changes and possible trend reversals.
Fibonacci Levels And Chart Structures
Fibonacci retracement levels are commonly used as psychological support and resistance zones. After a strong rally, gold often retraces toward the 38.2% or 61.8% Fibonacci levels before resuming its broader trend.
When these levels are combined with chart patterns in gold trading, such as the “Head and Shoulders” or “Cup and Handle,” traders gain a clearer view of market sentiment. Learning candlestick patterns can improve timing even further by revealing the struggle between buyers and sellers within a single trading session.
Combining Fundamentals And Technicals Into One Strategy
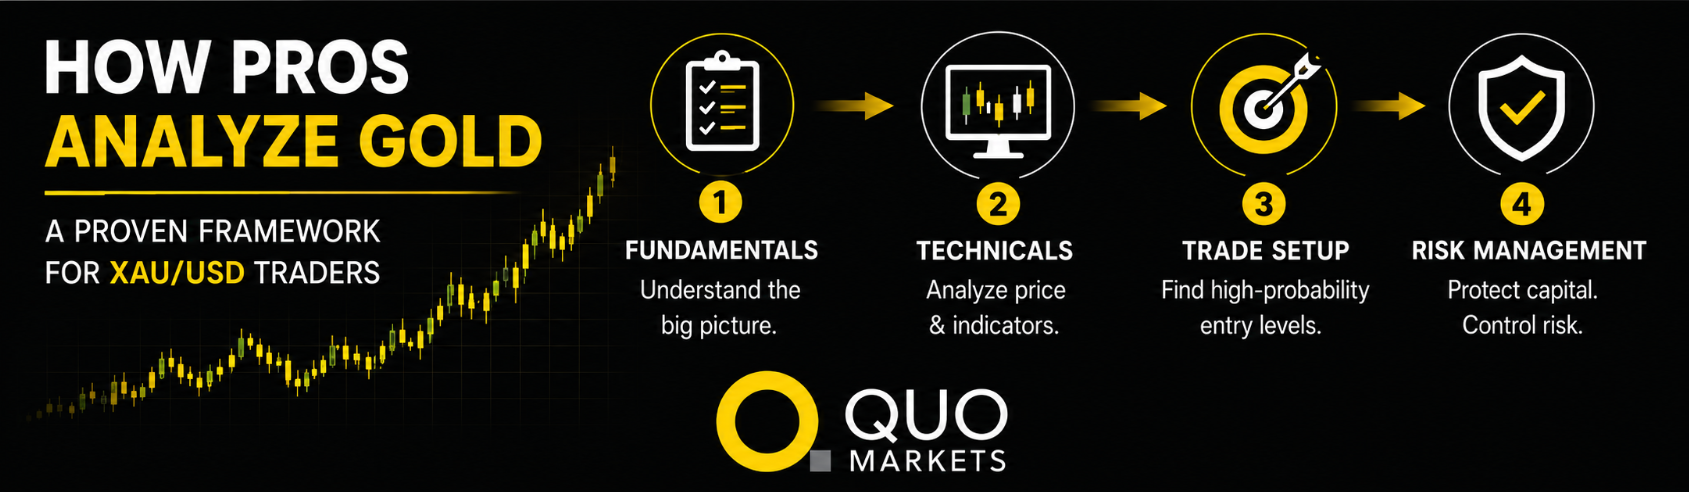
The strongest gold investment strategies do not rely entirely on either fundamentals or technical analysis. Successful traders combine both approaches.
Using News Events With Technical Levels
A good example is a Federal Reserve interest rate announcement. If the Fed pauses rate hikes, the news may support gold prices from a fundamental perspective.
A trader would then check their gold technical analysis today to see whether the price is sitting near an important support zone. If bullish news appears while gold trades near a major technical support level, the chances of a successful trade improve significantly.
Understanding Market Volatility
Gold market volatility often increases when fundamentals and technical signals point in different directions.
For example, gold market fundamentals may support buying because recession fears and gold demand are rising, while technical charts show the price approaching a major resistance area. In this situation, experienced traders usually wait for confirmation.
The goal is to find a confluence where gold market sentiment supports a gold price breakout already visible on the chart. This approach lowers the risk of getting caught in a fake breakout where prices spike on news and reverse immediately afterward.
A Real Example Of Gold Market Analysis
Here is a practical example of how traders analyze gold price movements using both methods together.
Imagine a period where the gold market outlook for 2026 was influenced by unexpectedly high inflation data.
As the Consumer Price Index (CPI) came in above forecasts, the inflation impact on gold initially pushed prices higher. At the same time, traders expected the Federal Reserve to raise interest rates aggressively, which strengthened the US dollar. This created conflicting signals in the gold fundamental analysis.
To understand the market better, traders would then turn to the XAU/USD technical analysis. If gold managed to remain above its 200-day moving average despite dollar strength, it would suggest strong underlying demand, likely supported by central bank gold reserves buying during price dips.
During this period, spotting a bullish flag pattern on the daily chart could have helped traders form a gold price prediction using technical analysis that pointed toward a new all-time high.
Conclusion
Becoming consistently profitable in gold trading takes time, patience, and constant learning. Whether you are performing a detailed XAU/USD price analysis or simply checking gold trading technical indicators for short-term opportunities, it is important to remember that no single indicator or headline explains the entire market.
Learning how to analyze gold price action through both fundamental and technical perspectives helps traders develop a much stronger understanding of market behavior than relying on automated systems alone.
QuoMarkets offers advanced charting tools that allow traders to combine technical indicators with important economic data. The more experience you gain observing how macroeconomic factors affecting gold interact with price action, the more confident and consistent your gold trading analysis can become.
FAQs
How does inflation influence gold prices?
Inflation weakens the purchasing power of fiat currencies, which often increases demand for gold as a store of value. However, if inflation causes central banks to raise interest rates aggressively, higher real yields can temporarily reduce gold’s attractiveness.
Which indicators work best for trading XAU/USD?
Many professional traders combine the 50-day and 200-day Moving Averages for trend analysis, RSI for identifying stretched market conditions, and Fibonacci Retracement levels to locate potential pullback zones before trends continue.
What affects the gold price the most?
The biggest factors are real interest rates, the strength of the US dollar, and geopolitical stability. Gold usually moves opposite to the US dollar and real yields, while attracting demand during periods of economic uncertainty or political tension.
How can traders analyze gold prices for short-term trading?
Short-term traders rely heavily on technical analysis. Indicators such as RSI, MACD, and candlestick patterns on lower timeframes like 5-minute or 15-minute charts help identify momentum, entry points, and support or resistance areas.