
Golden Cross vs Death Cross: What Is the Difference
Markets rarely announce a change in direction at the perfect moment. Prices may begin recovering weeks before a new uptrend becomes clear, while a market that looks strong can weaken long before the decline becomes obvious. Moving average crossovers help traders assess these changes by comparing recent price movements with a longer-term trend.
Understanding golden cross vs death cross starts with one simple difference: a golden cross is generally considered bullish, while a death cross is generally considered bearish. Both patterns use moving averages to highlight shifts in market momentum, but neither predicts what prices will do next with certainty.
Because moving averages rely on historical prices, crossover signals often appear after a substantial market move has already taken place. They can also produce false signals when prices move sideways or fluctuate sharply.
This guide explains what each pattern means, how traders interpret crossovers, and which factors can help put these signals into perspective.
What Is a Golden Cross?
A golden cross occurs when a shorter-term moving average crosses above a longer-term moving average. The most widely used combination is the 50-day simple moving average (SMA) crossing above the 200-day SMA.
Traders generally interpret this as a bullish development because recent price performance is improving relative to the longer-term average.
A golden cross often forms after a market decline or consolidation phase. As prices recover, the shorter moving average rises toward the longer one. If the recovery continues, the shorter average eventually moves above it.
This crossover may indicate the beginning of a longer-lasting upward trend, but it does not confirm that a bull market has started. The strength of the recovery and the broader market environment still matter.
How a Golden Cross Forms
The pattern typically develops in three stages:
- Prior decline or consolidation: Prices have been falling or moving sideways, leaving the 50-day SMA below the 200-day SMA.
- Convergence: Prices begin improving, pushing the shorter moving average toward the longer one.
- Crossover: The 50-day SMA rises above the 200-day SMA, forming the golden cross.
The direction of both averages provides additional context. If both are rising, the crossover may fit a broader upward trend. If the 200-day SMA is still falling, the market’s longer-term direction may remain uncertain.
Why Traders Watch Golden Cross Signals
The golden cross gives traders a way to assess whether an earlier recovery is gaining strength. It is commonly monitored in equity markets, particularly on major stock indices and individual shares.
Traders can also study moving average crossovers in forex, commodities, and other markets. However, the usefulness of the pattern depends on the asset, timeframe, and surrounding price action.
For stock exposure, traders using QuoMarkets can study the underlying share price through CFDs. CFDs provide exposure to price movements without giving the trader ownership of the shares.
A golden cross describes a change in the relationship between two averages. It does not establish a price target, guarantee a continuing uptrend, or determine an appropriate level of risk.
What Is a Death Cross?
A death cross occurs when a shorter-term moving average crosses below a longer-term moving average. In the conventional setup, the 50-day SMA falls below the 200-day SMA.
The pattern is generally interpreted as bearish because recent price performance has weakened relative to the longer-term average. A death cross may develop after an extended uptrend, around a market peak, or during an ongoing decline. By the time the crossover appears, prices may already have fallen significantly.
This timing matters. A death cross can accompany the beginning of a prolonged downturn, but it can also appear after much of the decline has already occurred.
How a Death Cross Forms
The death cross also develops through three broad stages:
- Weakening market conditions: Prices begin to lose momentum, or an existing decline gathers pace.
- Convergence: The 50-day SMA falls toward the 200-day SMA as recent prices weaken.
- Crossover: The shorter average moves below the longer one, forming the death cross.
Traders may interpret the pattern as evidence that market weakness is spreading into the longer-term trend. However, the crossover alone cannot establish whether a bear market has started.
For example, an index may fall sharply following disappointing economic data. Its 50-day SMA eventually crosses below the 200-day SMA, but prices then stabilize and recover. In this case, the death cross appears during a decline that does not continue indefinitely.
Why Traders Monitor Death Cross Signals
Death cross signals can help traders assess whether a market’s recent weakness is becoming more persistent. Analysts commonly monitor the pattern on indices such as the S&P 500 and Nasdaq Composite, as well as on individual stocks.
Some traders also examine death crosses when studying potential short-selling scenarios. However, a bearish crossover does not mean prices must continue falling. Entering a market after a substantial decline also carries the risk that the move is already losing momentum.
Golden Cross vs Death Cross: Key Differences
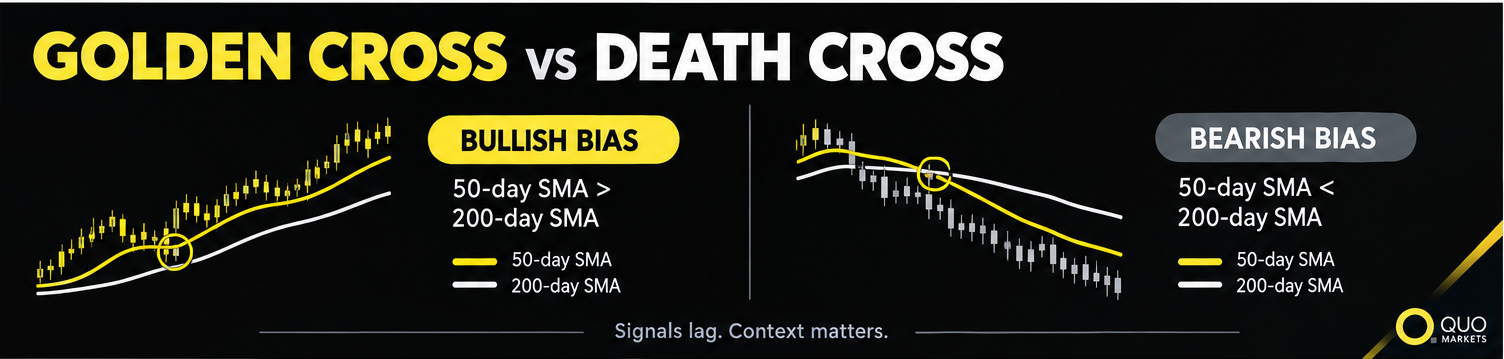
The main difference between a golden cross and a death cross is the direction of the shorter moving average relative to the longer one.
Both patterns compare recent market performance with a longer period of price history. Neither should be interpreted in isolation.
A golden cross in a weak market may mean something different from one accompanied by broad market strength. Likewise, a death cross during a temporary correction may have a different significance from one that develops alongside persistent selling pressure.
How Moving Averages Work
Moving averages smooth price data over a selected period, making it easier to identify broader trends without focusing on every short-term fluctuation.
Simple Moving Average (SMA)
A simple moving average calculates the average price over a specified number of periods. For example, a 50-day SMA adds the closing prices from the latest 50 trading sessions and divides the total by 50. The calculation updates as each new session closes. A 200-day SMA uses 200 trading sessions, so it responds more slowly to recent price changes. This difference in speed allows traders to compare shorter-term price behavior with a broader trend.
The 50-day and 200-day SMAs are widely used in equity market analysis, although traders can choose other periods depending on their approach.
Exponential Moving Average (EMA)
An exponential moving average gives greater weight to recent prices, allowing it to respond more quickly to new market movements than an SMA with the same period.
Traders can use EMAs to identify golden and death crossovers, but the results may differ from those produced by simple moving averages. The conventional definitions of a golden cross and death cross usually refer to the 50-day and 200-day SMAs.
Why Moving Averages Lag Behind Price
Moving averages are lagging indicators because they are calculated from historical data. They cannot reflect a change in market direction until new prices affect their calculations.
As a result, a golden cross may appear after a recovery is already well underway, while a death cross may form after a significant decline. This delay is one of the main limitations of moving average crossovers. They can help describe a developing or established trend, but they cannot identify the exact moment a market will reverse.
How Traders Interpret Golden Cross and Death Cross Patterns
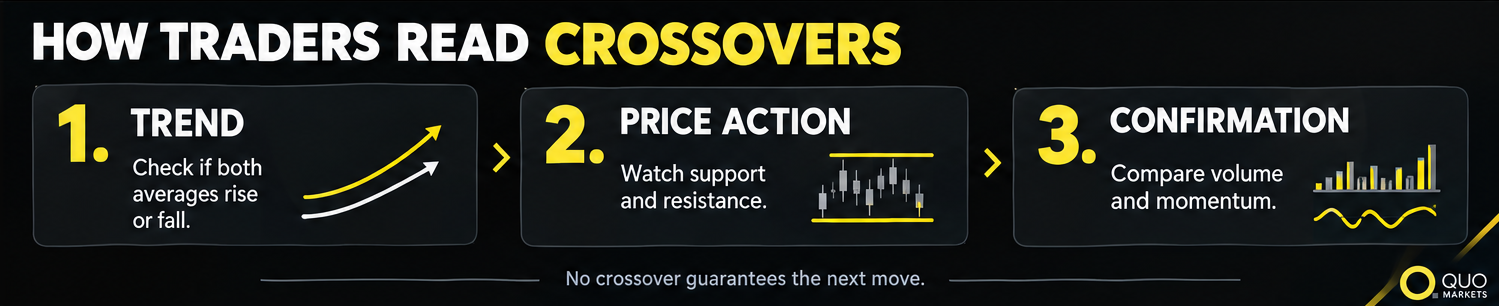
Experienced traders generally treat crossovers as one part of a broader technical analysis rather than as automatic instructions to enter a position.
1. Examine the Broader Trend
The direction of both moving averages can provide useful context.
If both averages are rising when a golden cross occurs, the pattern may support the view that an upward trend is developing. If the 200-day SMA is still declining, the crossover could reflect an early recovery within a weaker long-term market.
The same principle applies to a death cross. Two declining averages may indicate persistent weakness, while a crossover against a flat or rising long-term average may suggest a less decisive change.
2. Check Price Action and Support Levels
Moving average crossovers become easier to interpret when viewed alongside the price chart. Traders may examine whether prices are forming higher highs and higher lows, breaking above resistance, or falling below established support.
For example, a golden cross accompanied by a sustained move above resistance may indicate improving market conditions. If prices repeatedly fail to move beyond that level, the bullish interpretation may deserve more caution.
After a death cross, traders may look for continued weakness below support or signs that the market is stabilizing. A recovery above important price levels can challenge the bearish outlook.
3. Consider Trading Volume
Volume measures how much of an instrument has been traded during a given period. In equity markets, rising volume during a rally can indicate greater participation in the upward move. Some traders therefore look for increased volume around a golden cross or examine whether selling pressure accompanies a death cross.
Volume is not definitive confirmation, however. Its interpretation depends on the market. Spot forex, for example, has no single centralized exchange reporting total global trading volume, so volume figures from an individual provider may represent only part of the market.
4. Compare the Crossover With Momentum Indicators
Other technical indicators can provide additional information about market momentum.
The relative strength index (RSI) measures the pace of recent price gains and losses. Traders may use it to assess whether momentum is strengthening or weakening and whether its readings support the picture suggested by a crossover.
The stochastic oscillator compares a closing price with its recent price range. It can help assess short-term momentum, although readings need to be interpreted in the context of the prevailing trend.
When several indicators point in the same direction, traders may have more context for understanding market conditions. Conflicting signals, meanwhile, can highlight uncertainty. Using more indicators does not guarantee a better outcome, since many are based on the same underlying price data.
Which Timeframes Matter Most?
Golden cross and death cross patterns can appear on charts covering different periods. The timeframe affects how quickly a crossover develops and how much market history it reflects.
Daily and Weekly Charts
Daily charts are commonly used to identify the conventional 50-day and 200-day crossovers. Weekly charts offer a longer-term perspective, although the meaning of each period changes.
A 50-period moving average on a weekly chart represents 50 weeks rather than 50 trading days. It therefore reflects a much longer window of market activity.
Higher timeframes can help traders focus on broader trends rather than short-term price fluctuations. However, they can also produce later signals because the averages react more slowly to changing conditions.
Lower Timeframe Charts
On hourly and other intraday charts, traders may use shorter moving averages to examine more immediate changes in momentum.
These patterns differ from the conventional 50-day versus 200-day crossover. Shorter averages respond faster to price changes but can generate more false signals, particularly when the market moves sideways.
The appropriate timeframe depends on the trading approach. Someone studying a multiweek trend may focus on daily charts, while a longer-term market analysis may place more emphasis on weekly data.
Common Mistakes When Reading Crossovers

Even a clearly defined crossover can be misinterpreted. Three mistakes deserve particular attention.
Treating a Crossover as a Prediction
A golden cross suggests improving momentum, while a death cross suggests weakening momentum. Neither determines what happens next.
Economic data, central bank decisions, company earnings, and geopolitical developments can all change market conditions, sometimes before moving averages reflect the shift.
Ignoring False Signals
Sideways markets can cause prices to move repeatedly around two moving averages. The averages may cross several times without a sustained trend developing. Volatile conditions can produce similar whipsaws.
A brief rally may create a golden cross before prices fall again. A temporary correction may produce a death cross before the market recovers. Examining the broader trend, price structure, and other market information can help traders assess these situations, but no method eliminates false signals entirely.
Overlooking Risk Management
A crossover does not determine an appropriate position size, stop-loss level, or acceptable potential loss. Traders need to consider market volatility and their own risk limits when evaluating any trading scenario. This is especially important when using leveraged products such as CFDs, which can magnify losses as well as gains.
What Historical Market Examples Tell Us
Historical market data shows why death cross signals require careful interpretation.
A Reuters report published on April 14, 2025, examined approximately 50 years of S&P 500 data and identified 24 death crosses. According to the report, the index had already reached its maximum intraday decline before the crossover in 54% of those cases. In the remaining cases, the selloff worsened, with an average decline of 19% from the crossover point.
The report also discussed death crosses during major downturns, including those associated with the market declines of 1981, 2000, and 2007. These examples illustrate that a death cross can appear during a prolonged bear market or after much of a decline has already occurred.
These findings apply to the specific historical sample examined. They should not be treated as a universal probability for other indices, individual stocks, forex pairs, or commodities.
Golden crosses require similar caution. A bullish crossover may accompany a lasting recovery, but it can also appear during a rebound that eventually loses momentum. The outcome depends on market conditions, not the pattern alone.
Key Takeaways
Golden crosses and death crosses help traders compare recent price performance with a longer-term trend.
- Golden cross: The 50-day SMA crosses above the 200-day SMA, generally suggesting improving momentum.
- Death cross: The 50-day SMA crosses below the 200-day SMA, generally suggesting weakening momentum.
- Both are lagging indicators: A crossover may appear after a substantial price move has already occurred.
- Context matters: Trend direction, price action, volume, and momentum indicators can help explain the signal.
- False signals happen: Sideways and volatile markets can produce crossovers that fail to develop into sustained trends.
Understanding golden cross trading means recognizing what the pattern shows, as well as what it cannot tell you. The same applies to death cross signals. Both can support technical analysis, but neither offers a complete picture of future market direction.
FAQs
What Is the Main Difference Between a Golden Cross and a Death Cross?
A golden cross occurs when the 50-day SMA moves above the 200-day SMA and is generally considered bullish. A death cross occurs when the 50-day SMA falls below the 200-day SMA and is generally considered bearish.
Is a Golden Cross a Guarantee That the Market Will Rise?
No. A golden cross indicates that recent price performance has strengthened relative to the longer-term average. Prices can still fall afterward, particularly if the crossover develops during a temporary recovery or a sideways market.
Does a Death Cross Always Mean a Bear Market Has Started?
No. A death cross can accompany a prolonged downturn, but it can also appear near the end of a decline. Because moving averages lag behind prices, the crossover alone cannot confirm that a bear market has begun.
Which Moving Averages Are Used for Golden Cross and Death Cross Patterns?
The conventional combination is the 50-day and 200-day simple moving averages. Some traders use exponential moving averages or different periods, depending on their timeframe and analytical approach.
Can Traders Use These Patterns in Forex Trading?
Yes. Moving average crossovers can be studied in forex, commodities, stock indices, and other markets. Their interpretation depends on the asset, timeframe, volatility, and broader market conditions. A crossover should be treated as one piece of information rather than an automatic trading instruction.